Machine Management
Machine Management is the core module of the GMSSH Client, providing centralized management for server connections. Through an intuitive card view, you can monitor the connection status and resource usage of all servers at a glance, with support for group management, batch import, jump server proxy, and SSH tunneling — making multi-server operations efficient and organized.
Core Features
Machine Management covers the complete server connection lifecycle with the following core capabilities:
| Feature | Purpose | Core Capabilities |
|---|---|---|
| Machine Overview | Visual Server Monitoring | Card/list dual views, real-time CPU/Memory/Storage monitoring, online status |
| Group Management | Logical Organization | Custom groups, group filtering, group editing |
| Add Machine | Connection Configuration | Single add (password/certificate), jump server proxy, connection testing |
| Batch Add | Efficient Deployment | Text format batch import, group assignment |
| Terminal | SSH Command Line | One-click connect, multi-tab terminal, AI command generation |
| Tunnel Settings | Port Forwarding | Local forwarding, remote forwarding, dynamic forwarding |
| GMSSH Desktop | Visual Server Management | Desktop-style app launcher with all management tools |
| GMSSH Browser | Remote Web Access | Browse remote server web services within the client |
| Batch Execution | Multi-Machine Operations | Execute commands on multiple machines simultaneously |
Machine Overview
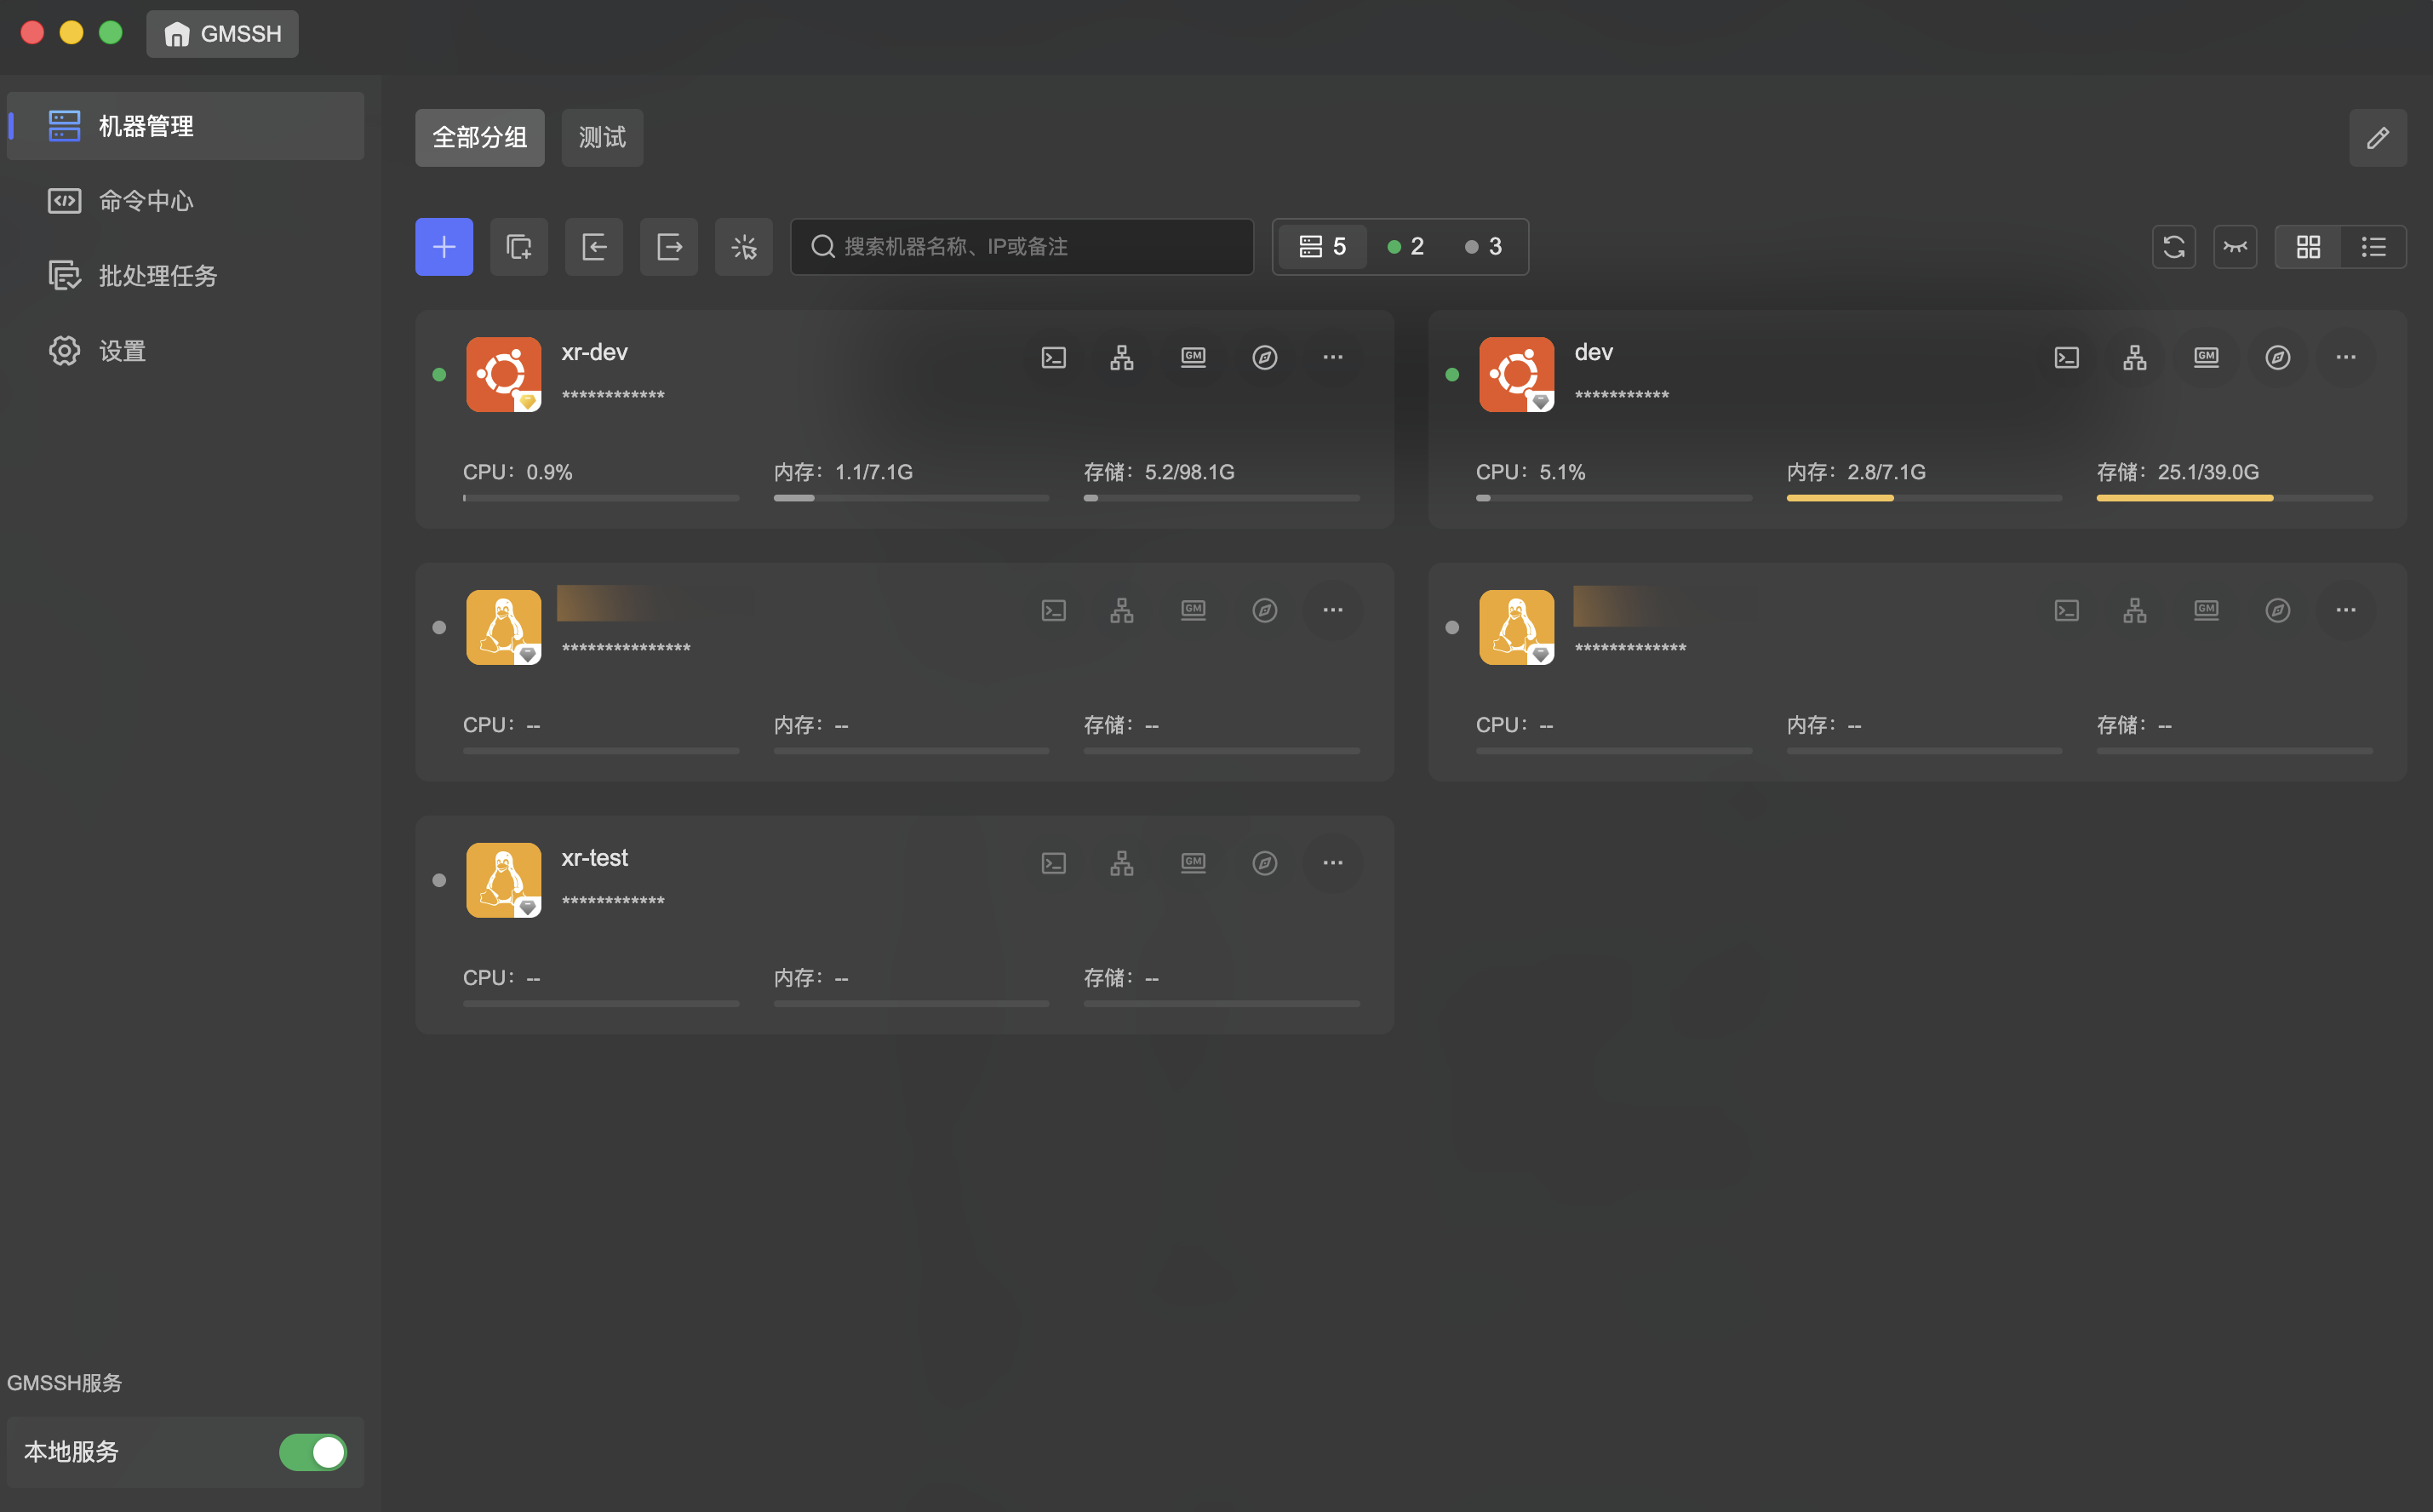
At-a-glance server status monitoring panel. The main interface displays all added servers in a card grid, with each server's connection status and resource usage clearly visible.
Machine Card: Each card shows a server's core information:
- Name & Address: Machine name and connection password (masked) at the top.
- Connection Status: Top-left dot indicates online status — green for online, gray for offline.
- Resource Monitoring: Bottom area shows three key metrics in real-time with progress bars for online machines.
View Modes: Top toolbar provides two view modes:
- Card View (grid icon): Grid layout for overview monitoring.
- List View (list icon): Compact list layout for managing large numbers of machines.
Groups & Filtering:
- Keyword Search: Search box supports fuzzy search by machine name, IP, or notes.
- Group Tabs: Top tabs display all groups (e.g., "All Groups", "Test"), click to filter by group.
- Group Editing: Click the edit icon to manage groups — add, rename, or delete groups.
Quick Action Bar: Each card provides a row of icon buttons for quick access to various features:
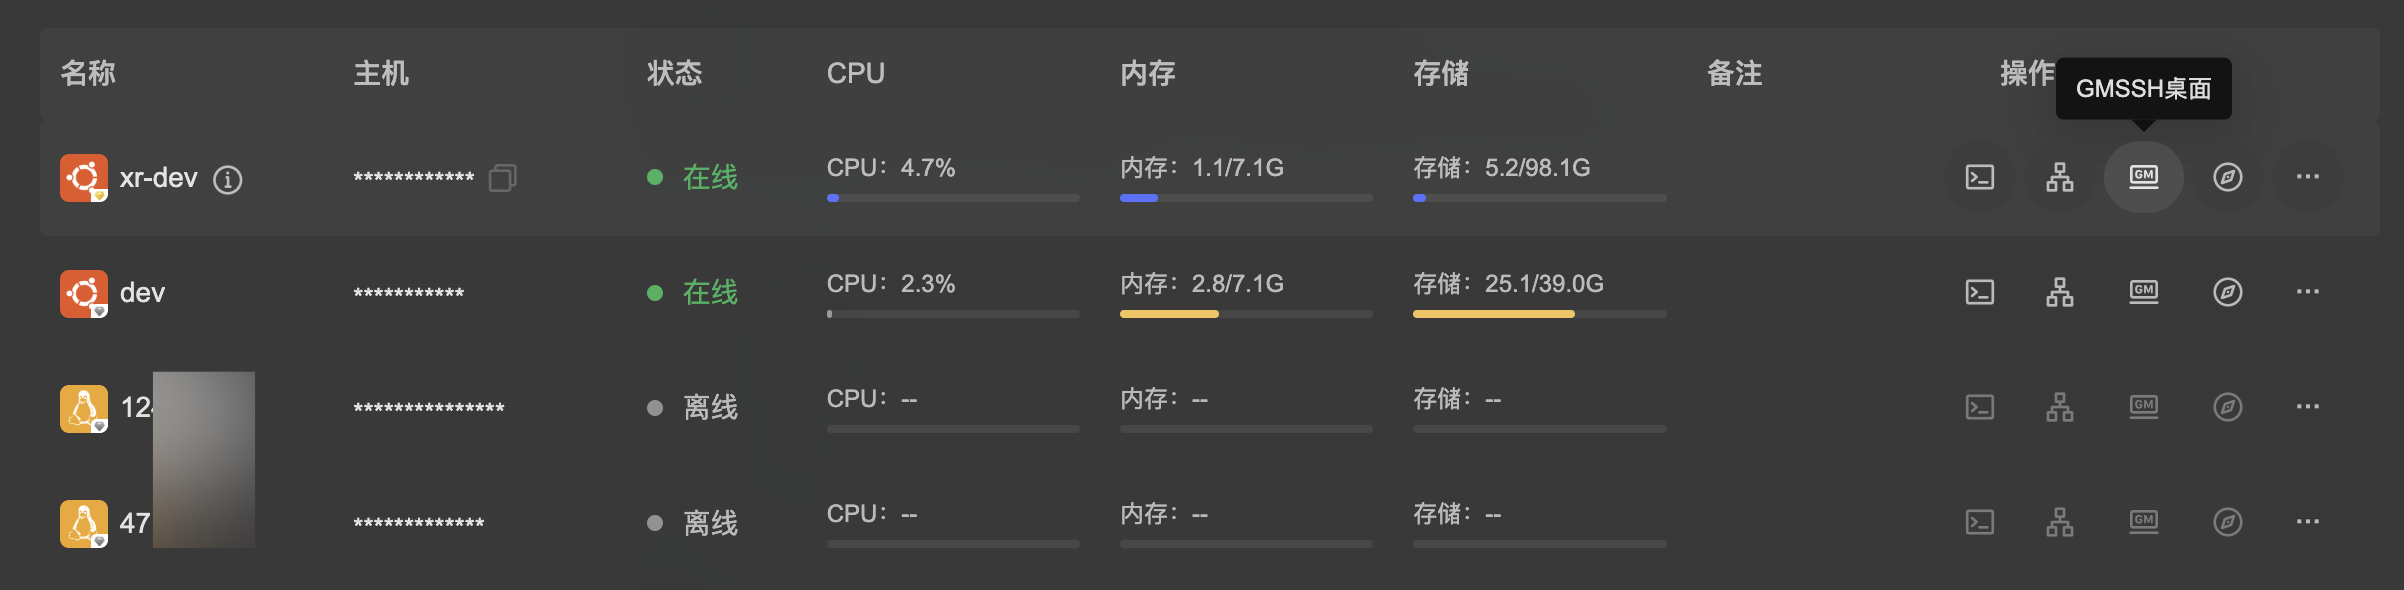
| Button (left to right) | Function | Description |
|---|---|---|
| Terminal | Open SSH Terminal | Enter the command line terminal for this machine |
| Tunnel | Tunnel Settings | Configure SSH port forwarding rules |
| GMSSH Desktop | Enter Visual Desktop | Open the GMSSH Desktop management system |
| GMSSH Browser | Open Browser | Access this machine via GMSSH Browser |
| More | More Actions | Edit, delete, and other advanced operations |
Add Machine
Click the "+" button on the left side of the toolbar to open the Add Machine dialog. The dialog contains two tabs: "Basic Settings" and "Jump Server".
Basic Settings
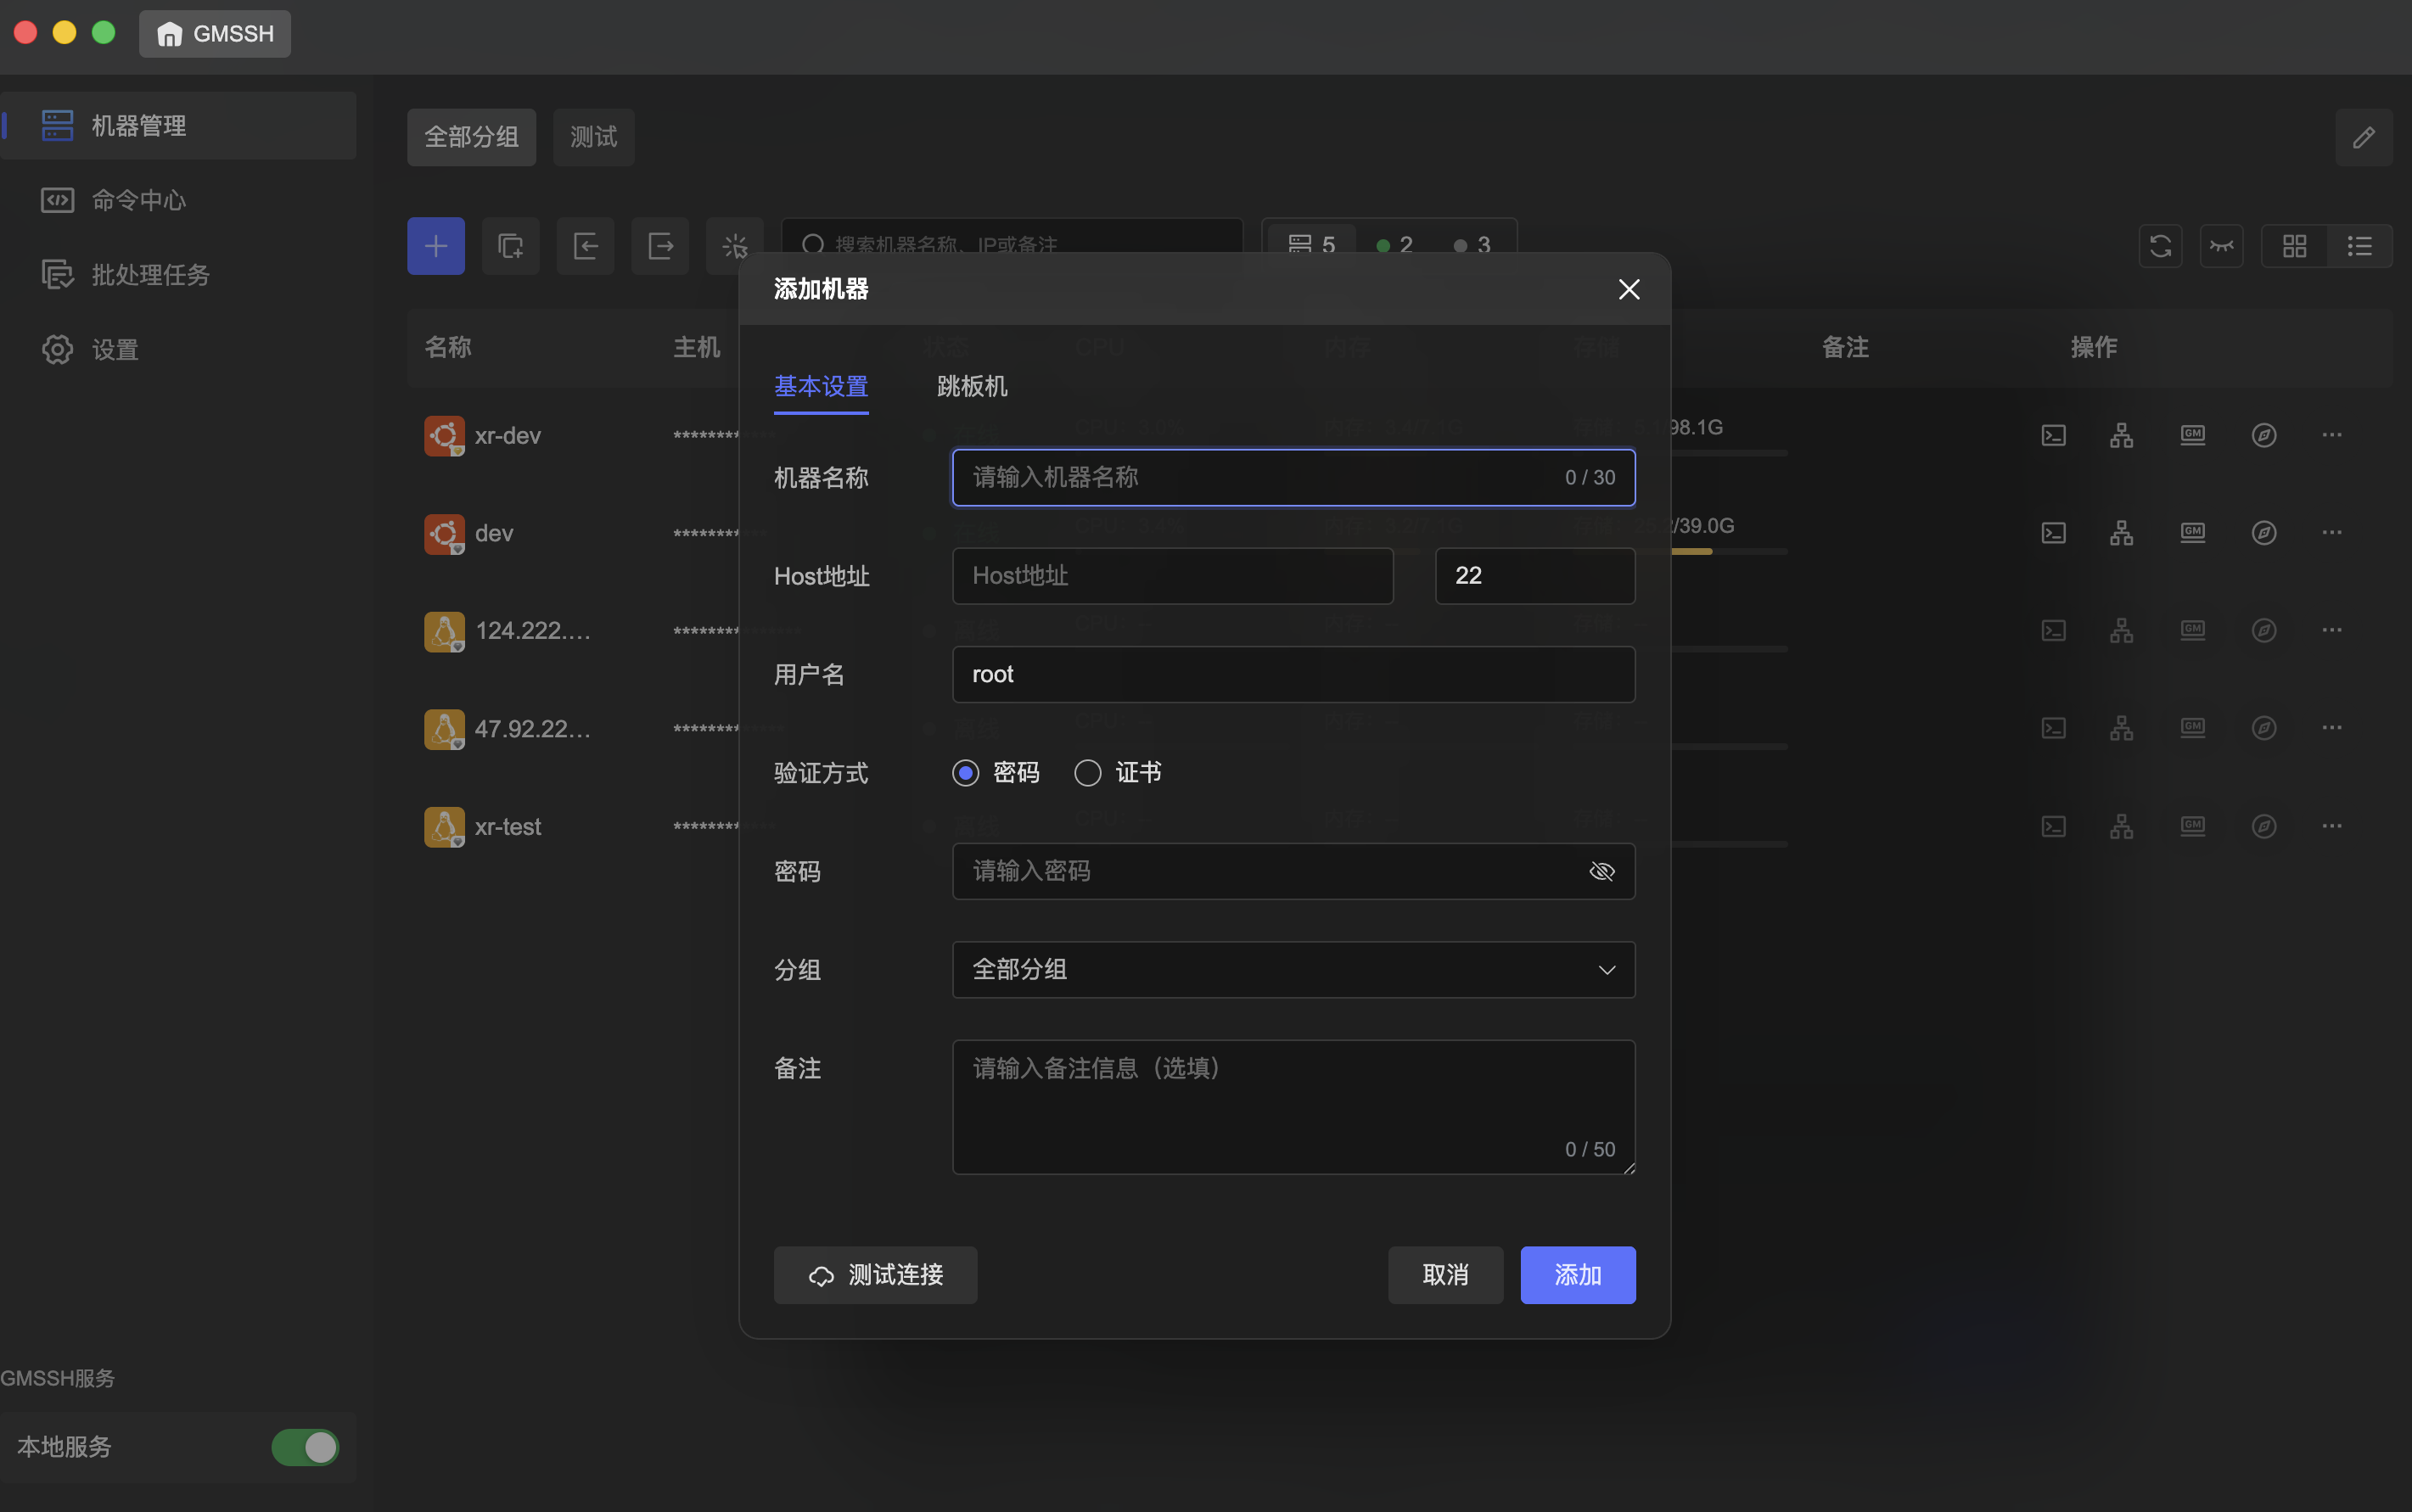
| Field | Description | Constraints |
|---|---|---|
| Machine Name | Custom display name for the machine | Max 30 characters |
| Host Address | Server IP address or domain name | — |
| Port | SSH connection port | Default 22 |
| Username | SSH login username | Default root |
| Auth Method | Authentication method: "Password" or "Certificate" | Toggle |
| Password | Required when auth method is "Password", with visibility toggle | — |
| Group | Assign the machine to a group | Dropdown, default "All Groups" |
| Notes | Optional supplementary notes | Max 50 characters |
Bottom action buttons:
- Test Connection: Click "Test Connection" to verify SSH connectivity before adding.
- Cancel / Add: Click "Add" to confirm, or "Cancel" to discard.
Jump Server
For intranet servers that cannot be accessed directly, you can use a Jump Server for relay connections.
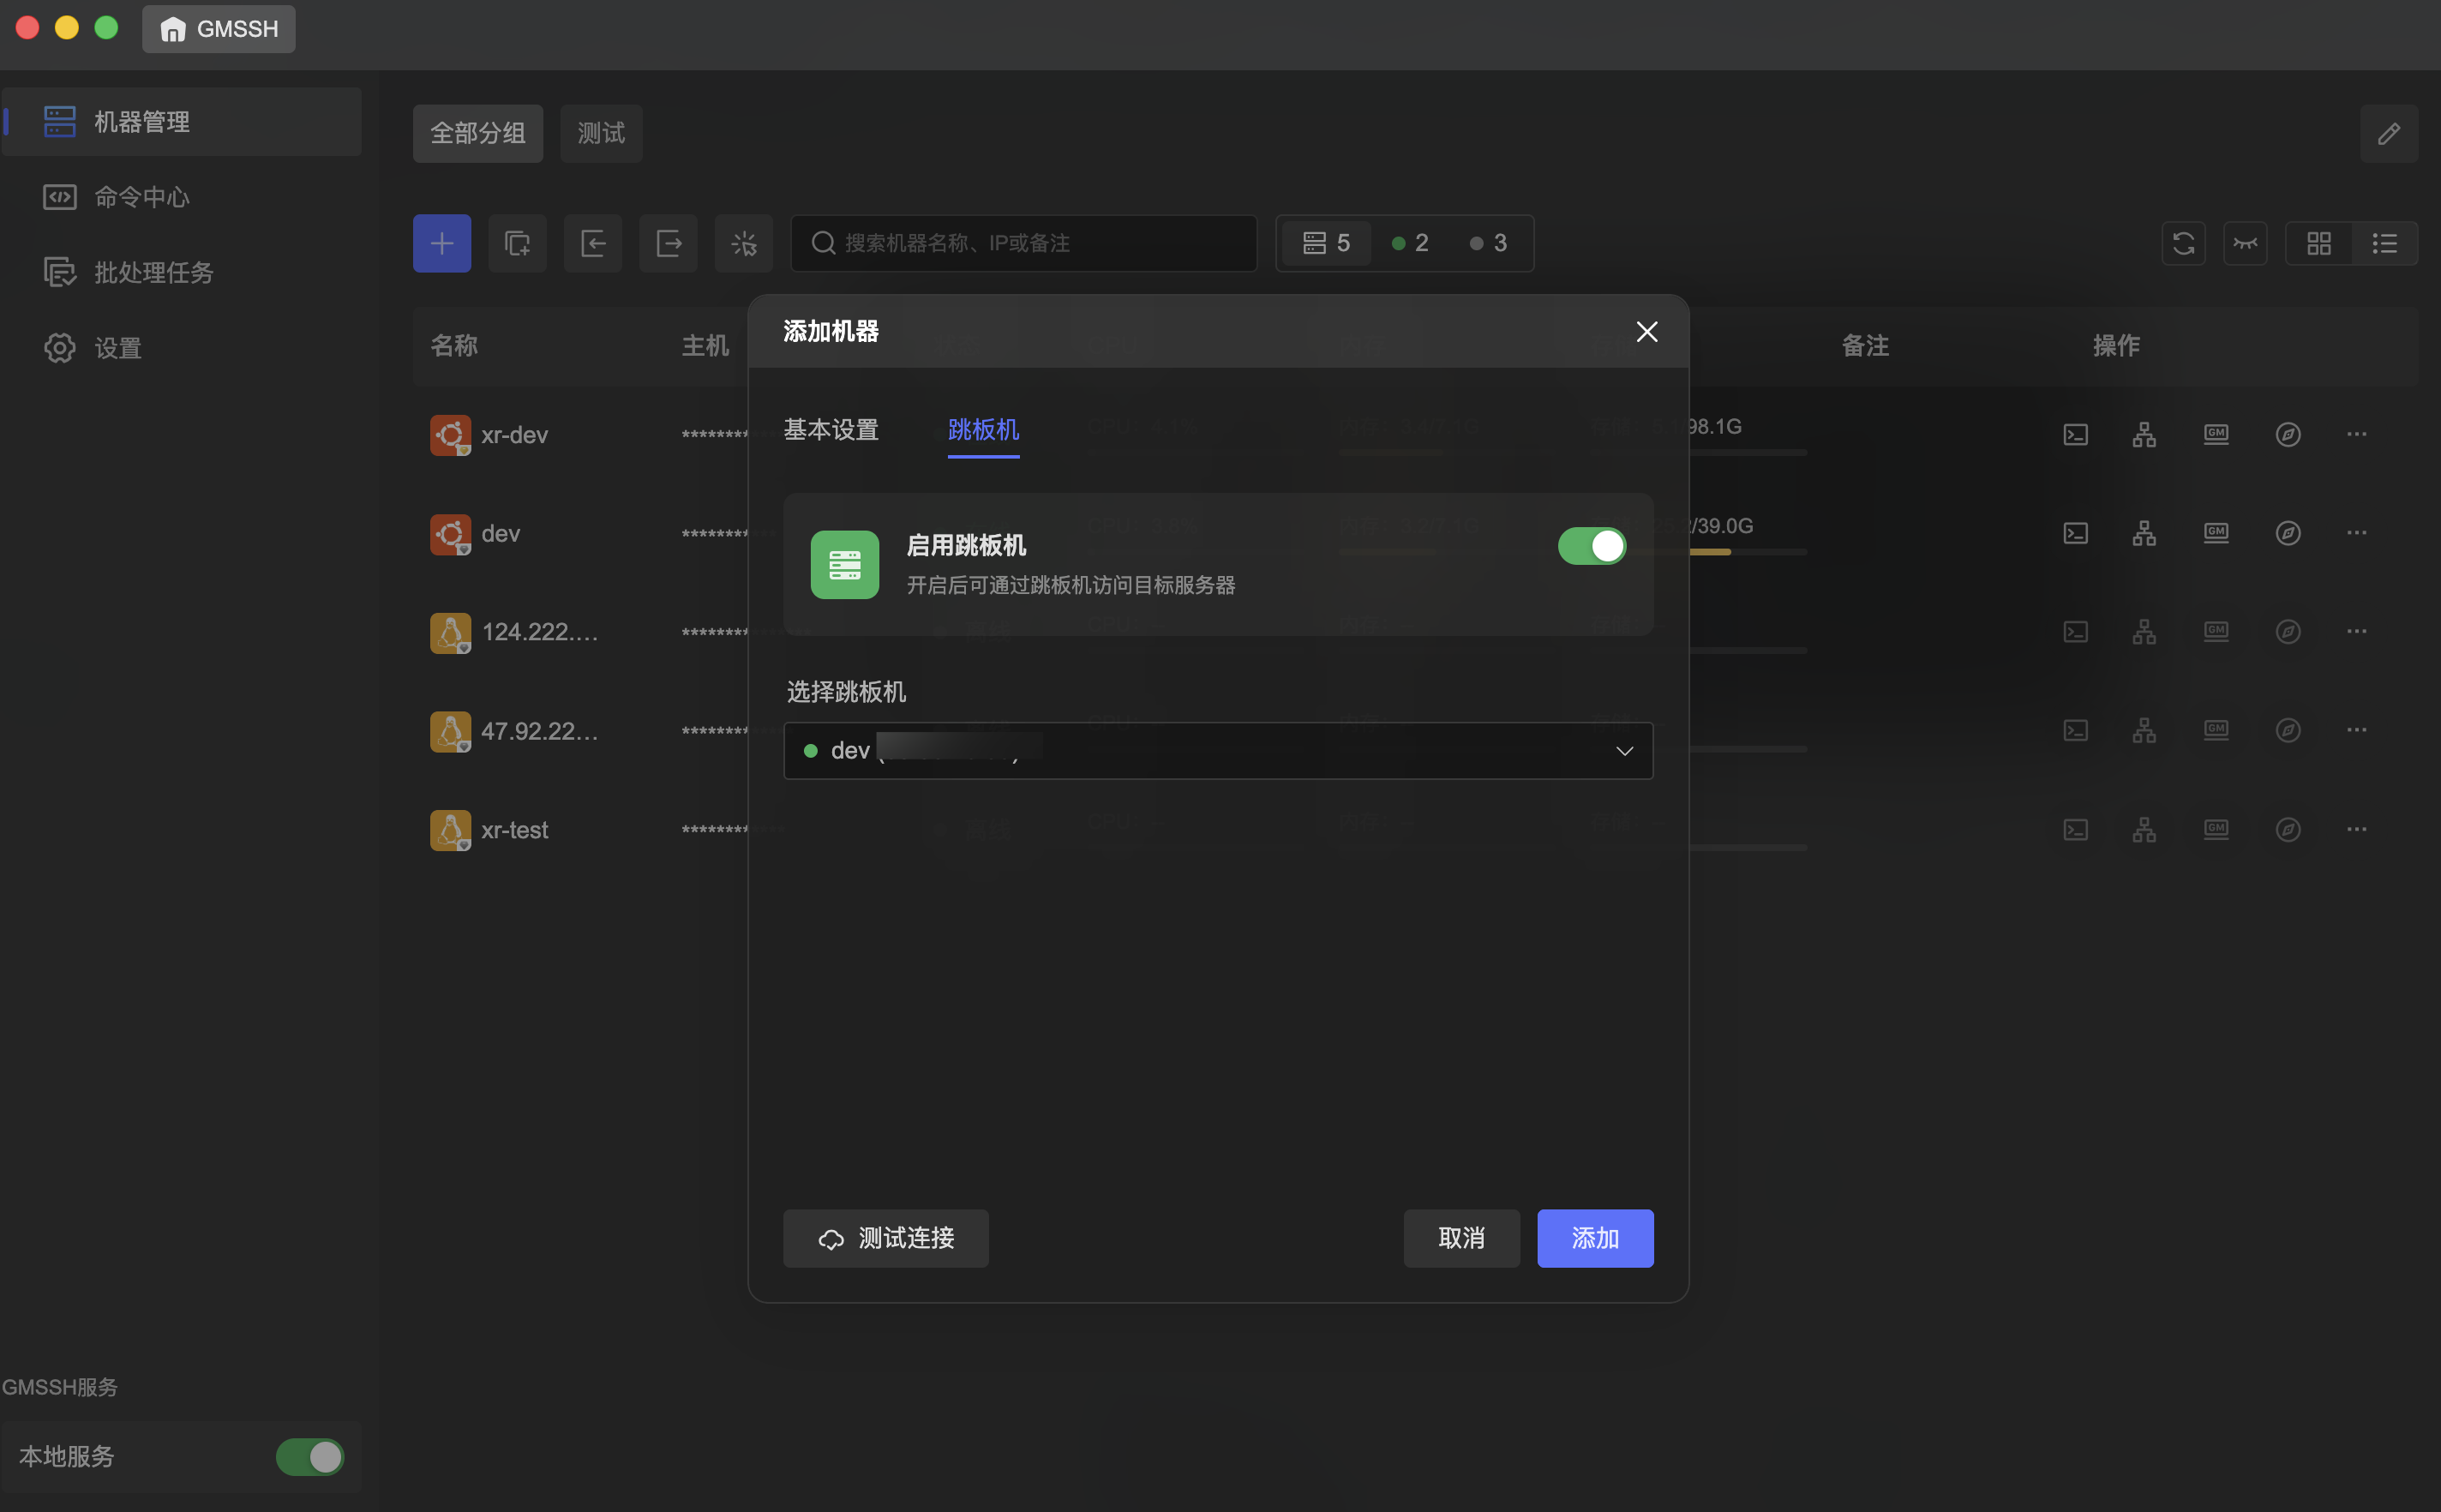
- Enable Jump Server: Toggle to enable/disable jump server proxy.
- Select Jump Server: Choose an online machine from the list as the jump server. The dropdown displays machine names and IPs, with green dots indicating online status.
Tip
Jump servers are ideal for scenarios where the target server is on an intranet, has no public IP, or security policies restrict direct connections. GMSSH automatically establishes an SSH tunnel through the jump server for transparent relay, with no manual ProxyJump configuration needed.
Batch Add Machines
Click the "Batch Add" button in the toolbar to open the batch import dialog for adding multiple servers at once.
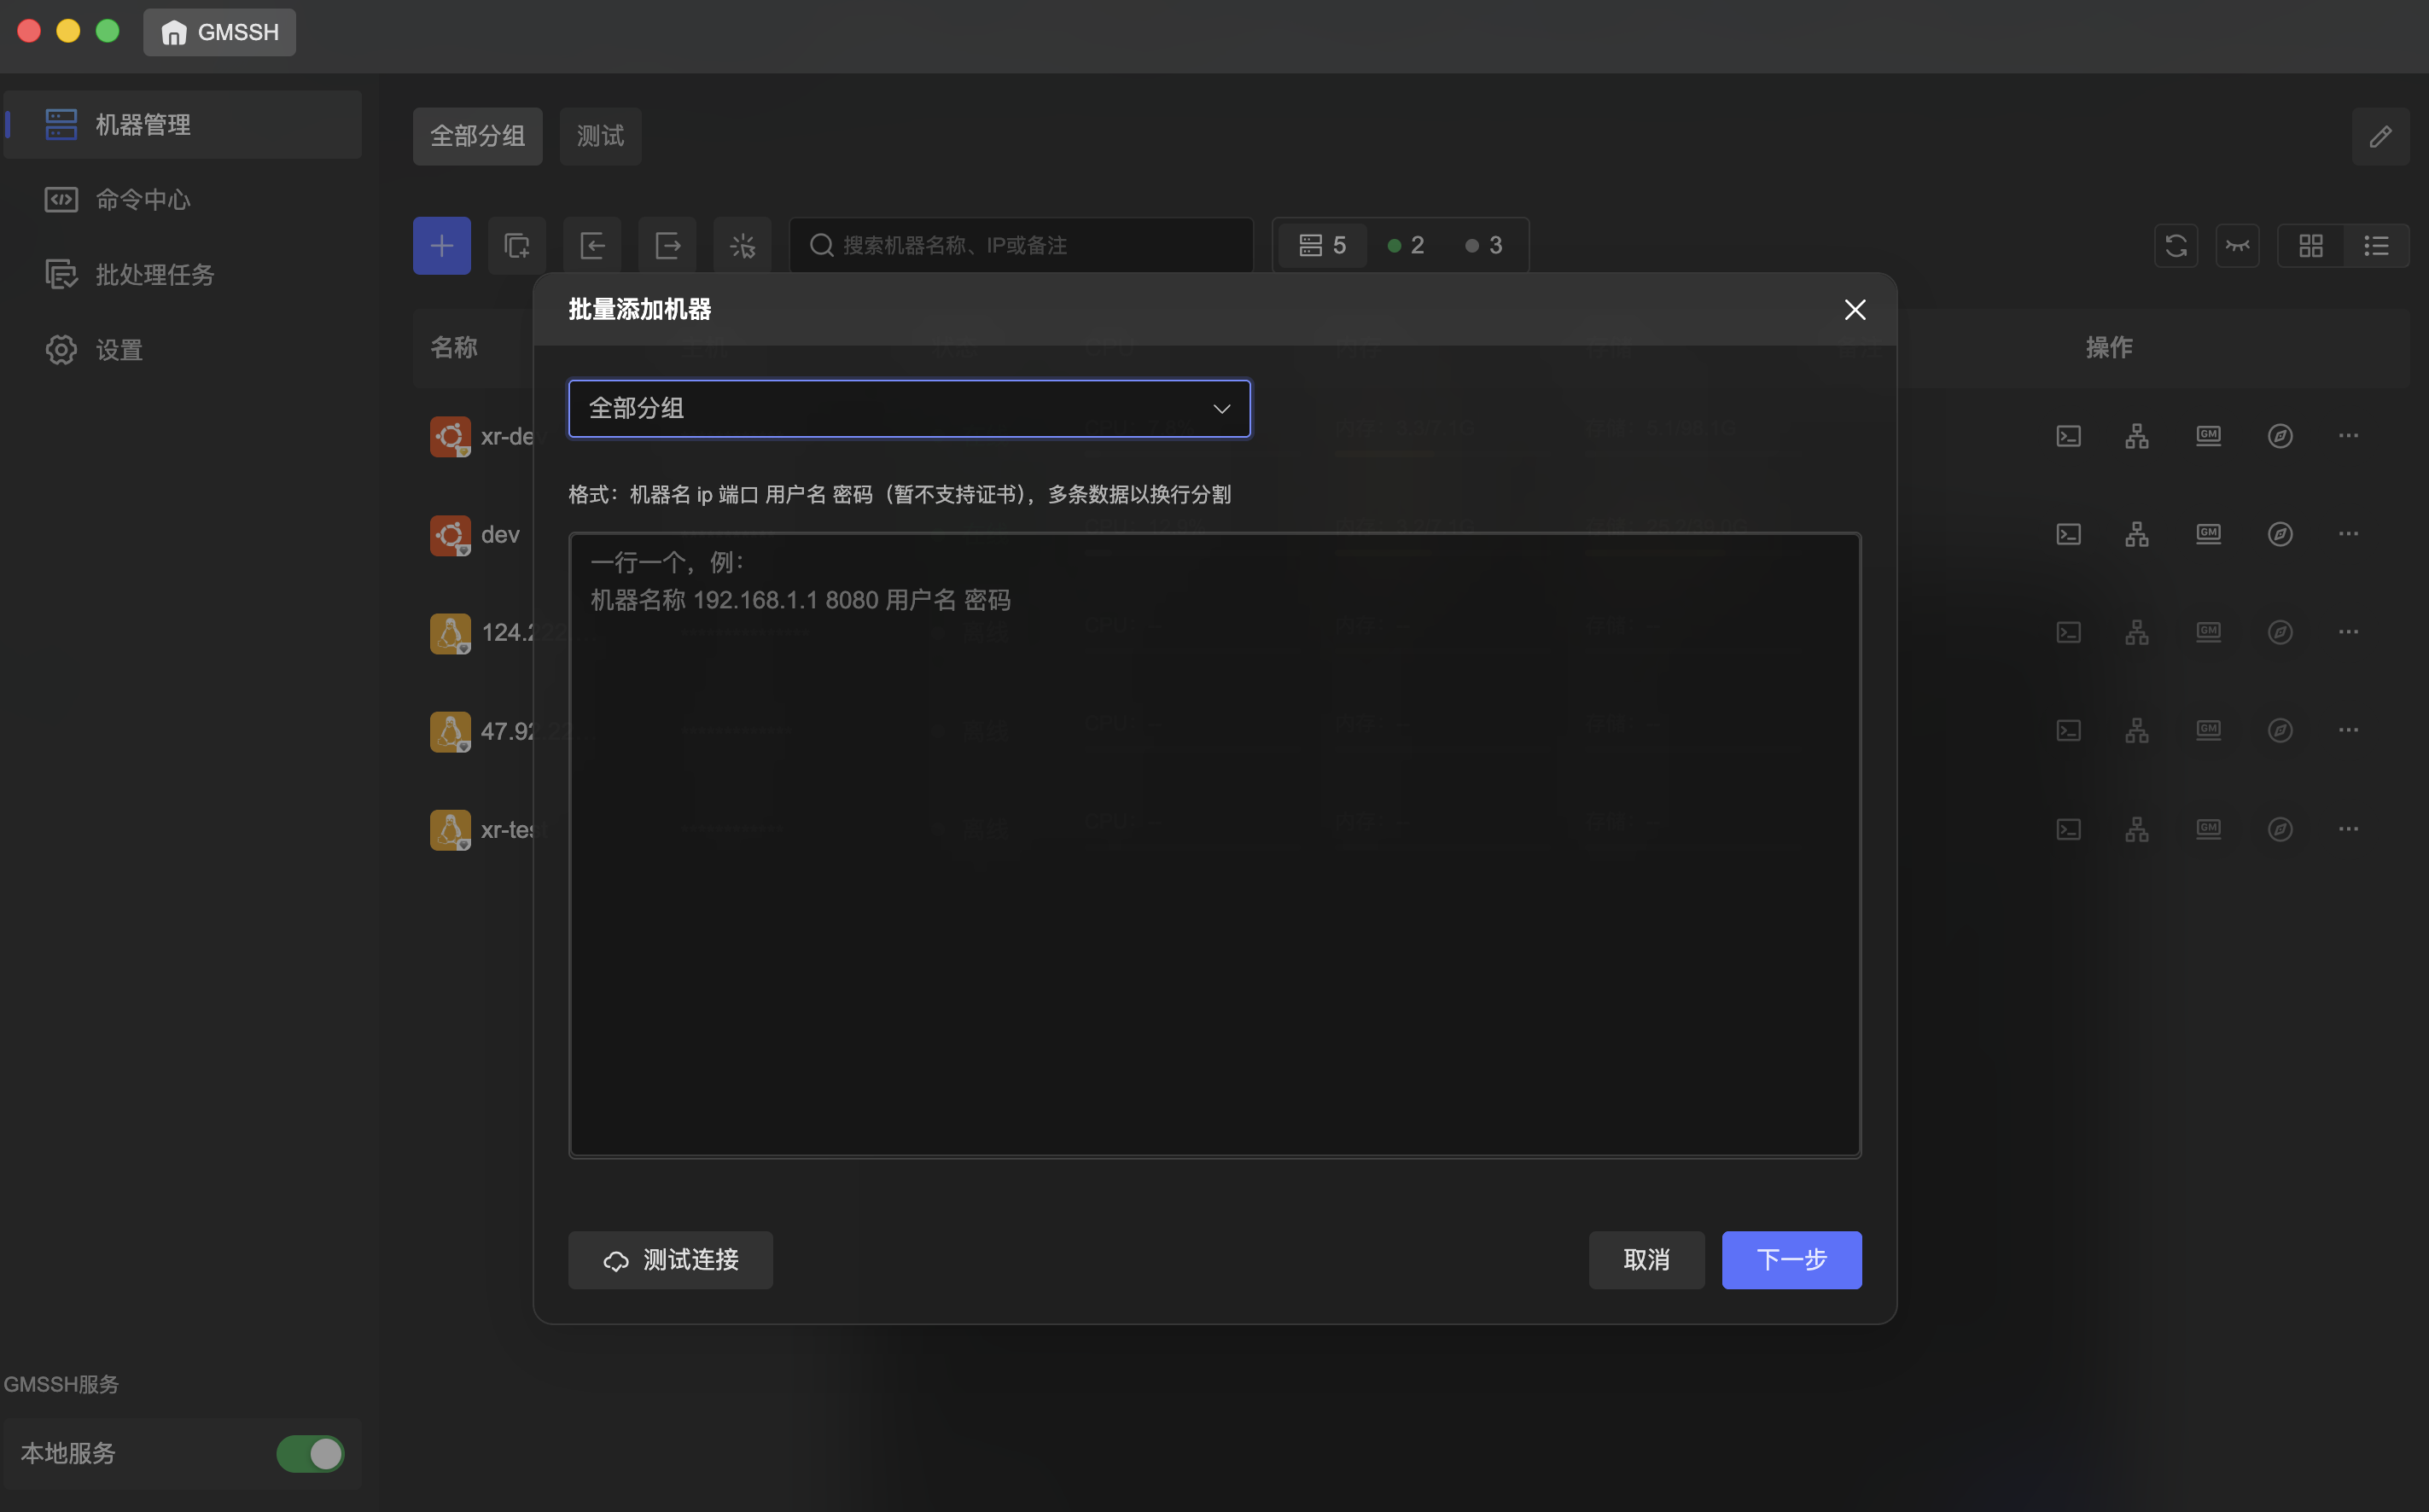
- Target Group: Select the target group from the top dropdown.
- Input Format: Enter machines in text format, one per line:
- Test Connection: Batch test connectivity for all entered machines.
- Cancel / Next: Click "Next" to proceed, or "Cancel" to discard.
MachineName IPAddress Port Username Password
- Example:
MyServer 192.168.1.1 8080 root password
Note
Batch add does not support certificate authentication — only password authentication. For certificate-based auth, use single machine add to configure each server individually.
Quick Access
Each machine card's action bar provides four core entry points for direct access to different management views.
Terminal
Click the "Terminal" button to establish an SSH connection and enter the command line terminal. The top tab bar displays the connected machine name and IP, supporting multi-tab multi-terminal simultaneous operation.
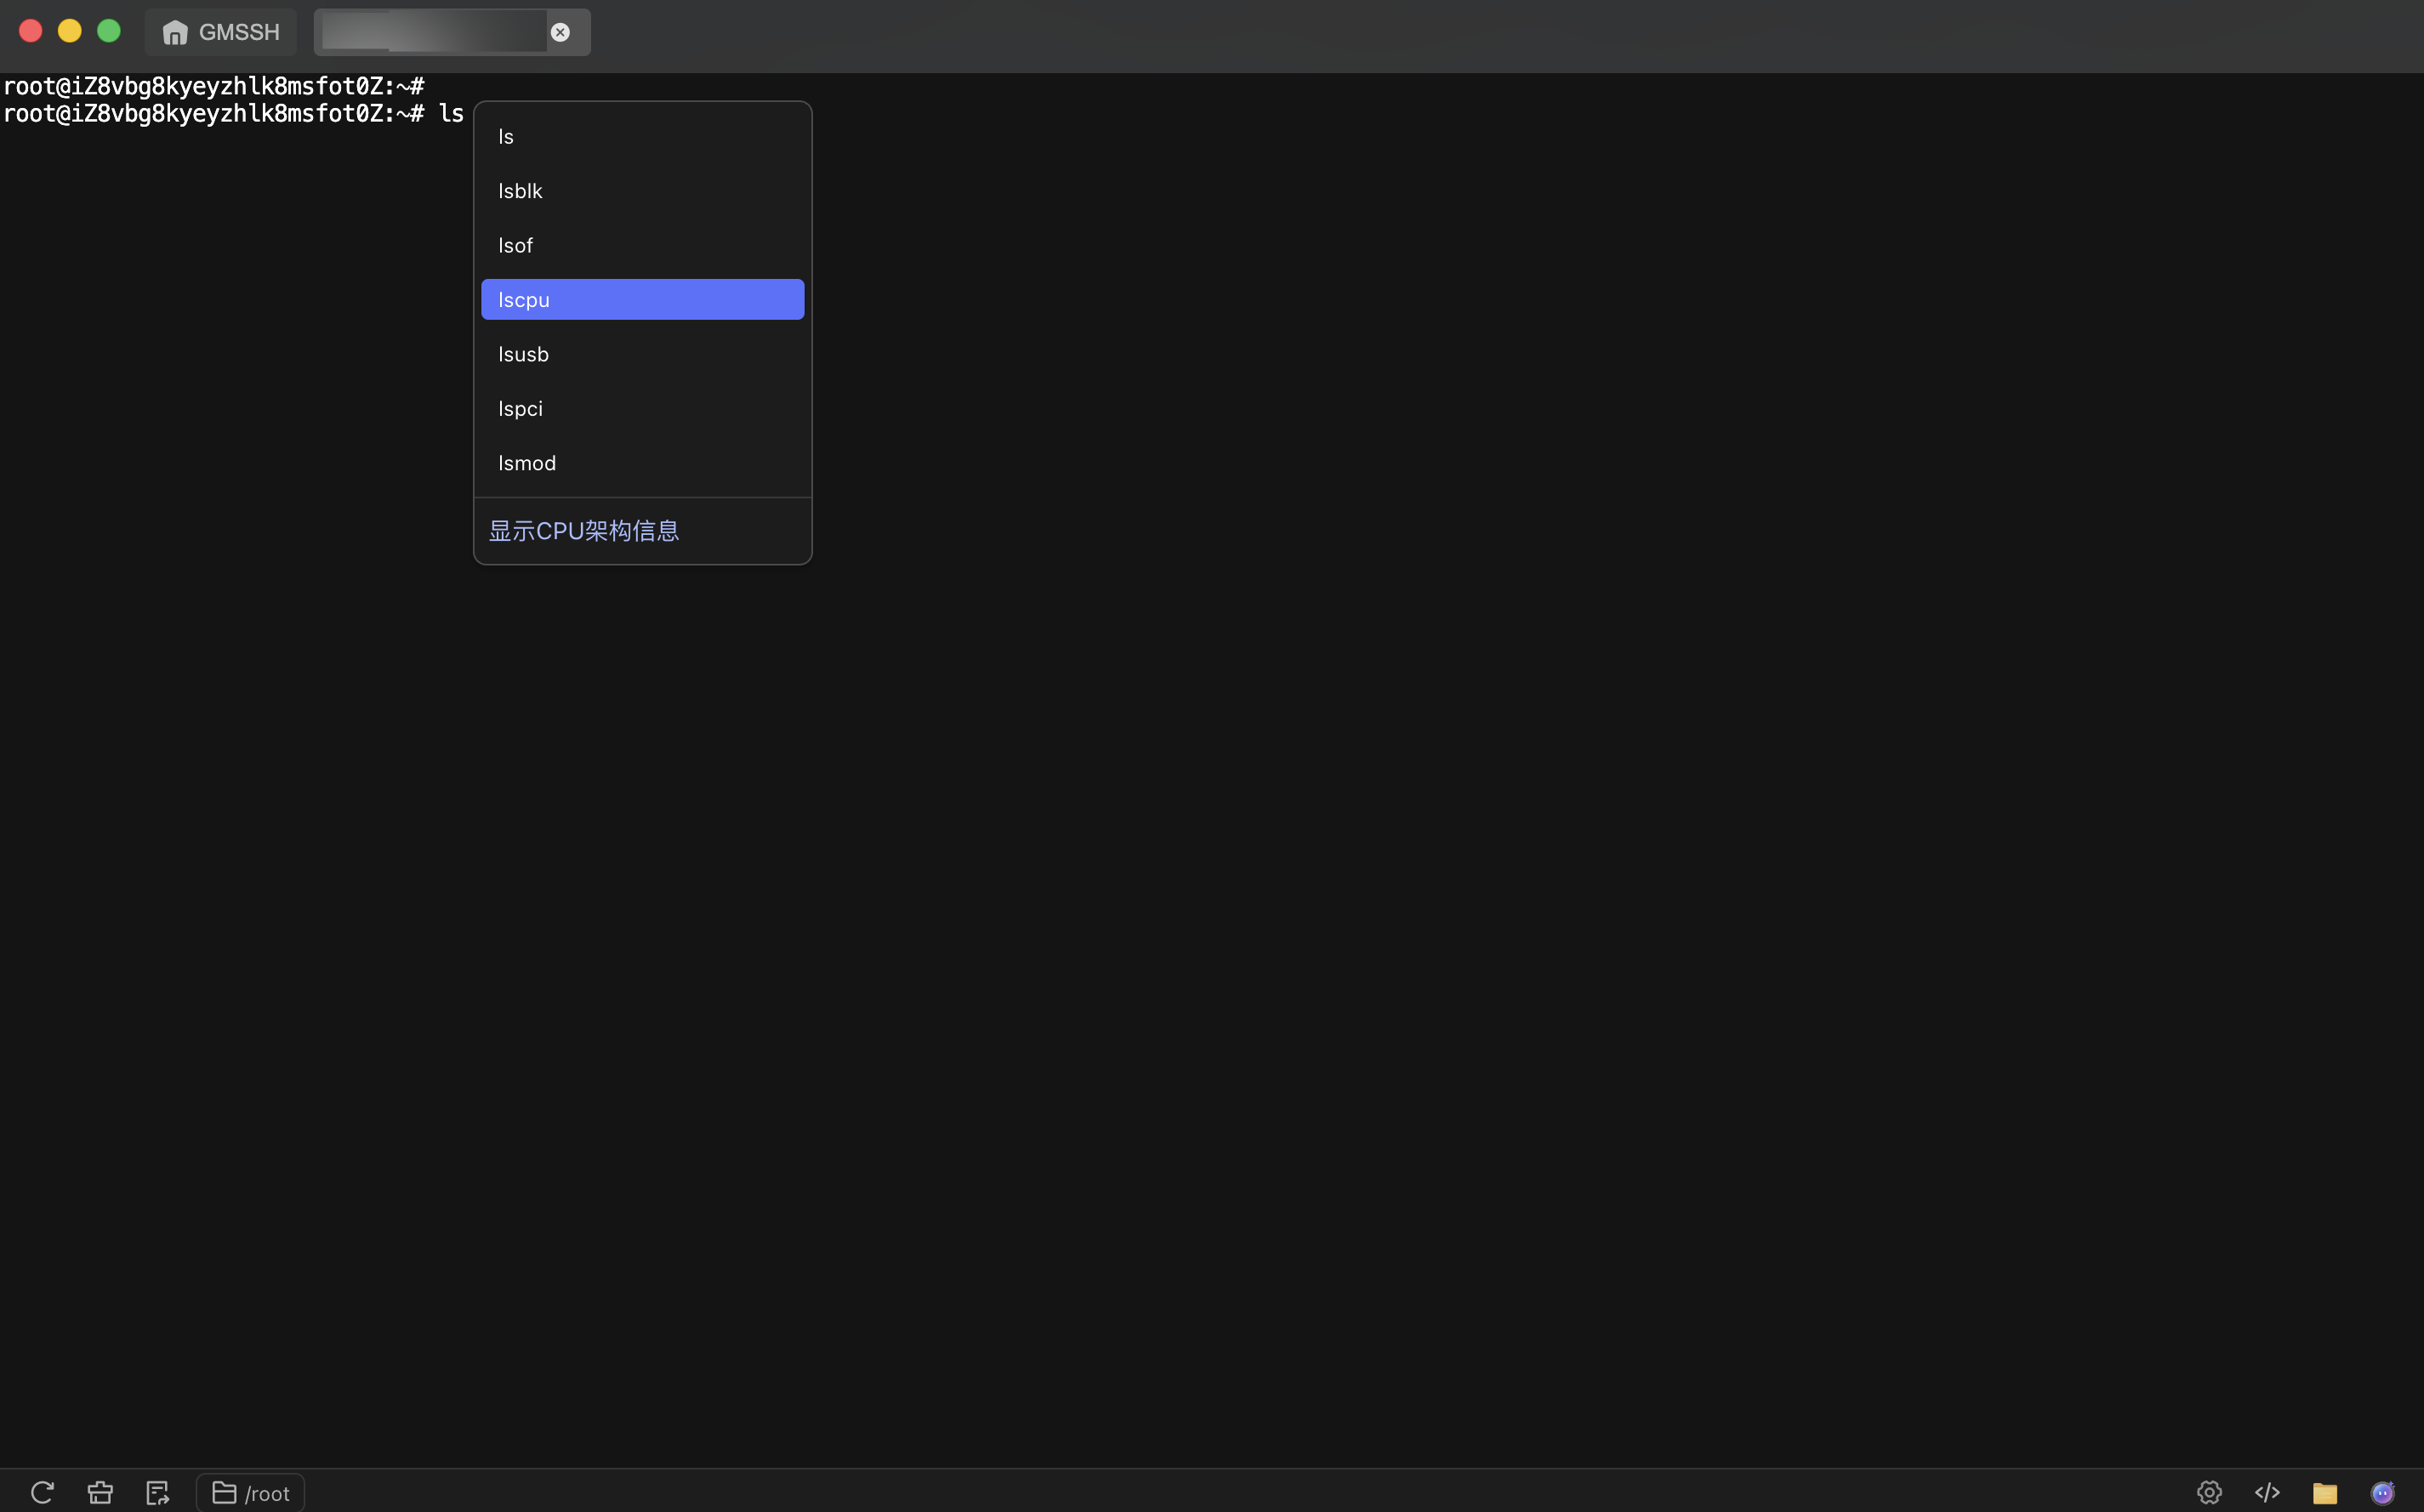
- SSH Connection: Automatically connects using the machine's configured credentials, no password re-entry needed.
- Smart Hints: Top hint bar shows shortcut information, such as
⌘ + Ifor AI command generation,⌘ + Lto open Gemius. - Bottom Toolbar: Quick tool buttons for one-click access to common operations.
Tip
For more terminal features, see: Terminal
GMSSH Desktop
Click the "GMSSH Desktop" button to enter the visual desktop management system. This is GMSSH's core operations interface, integrating all server management tools in a desktop metaphor.
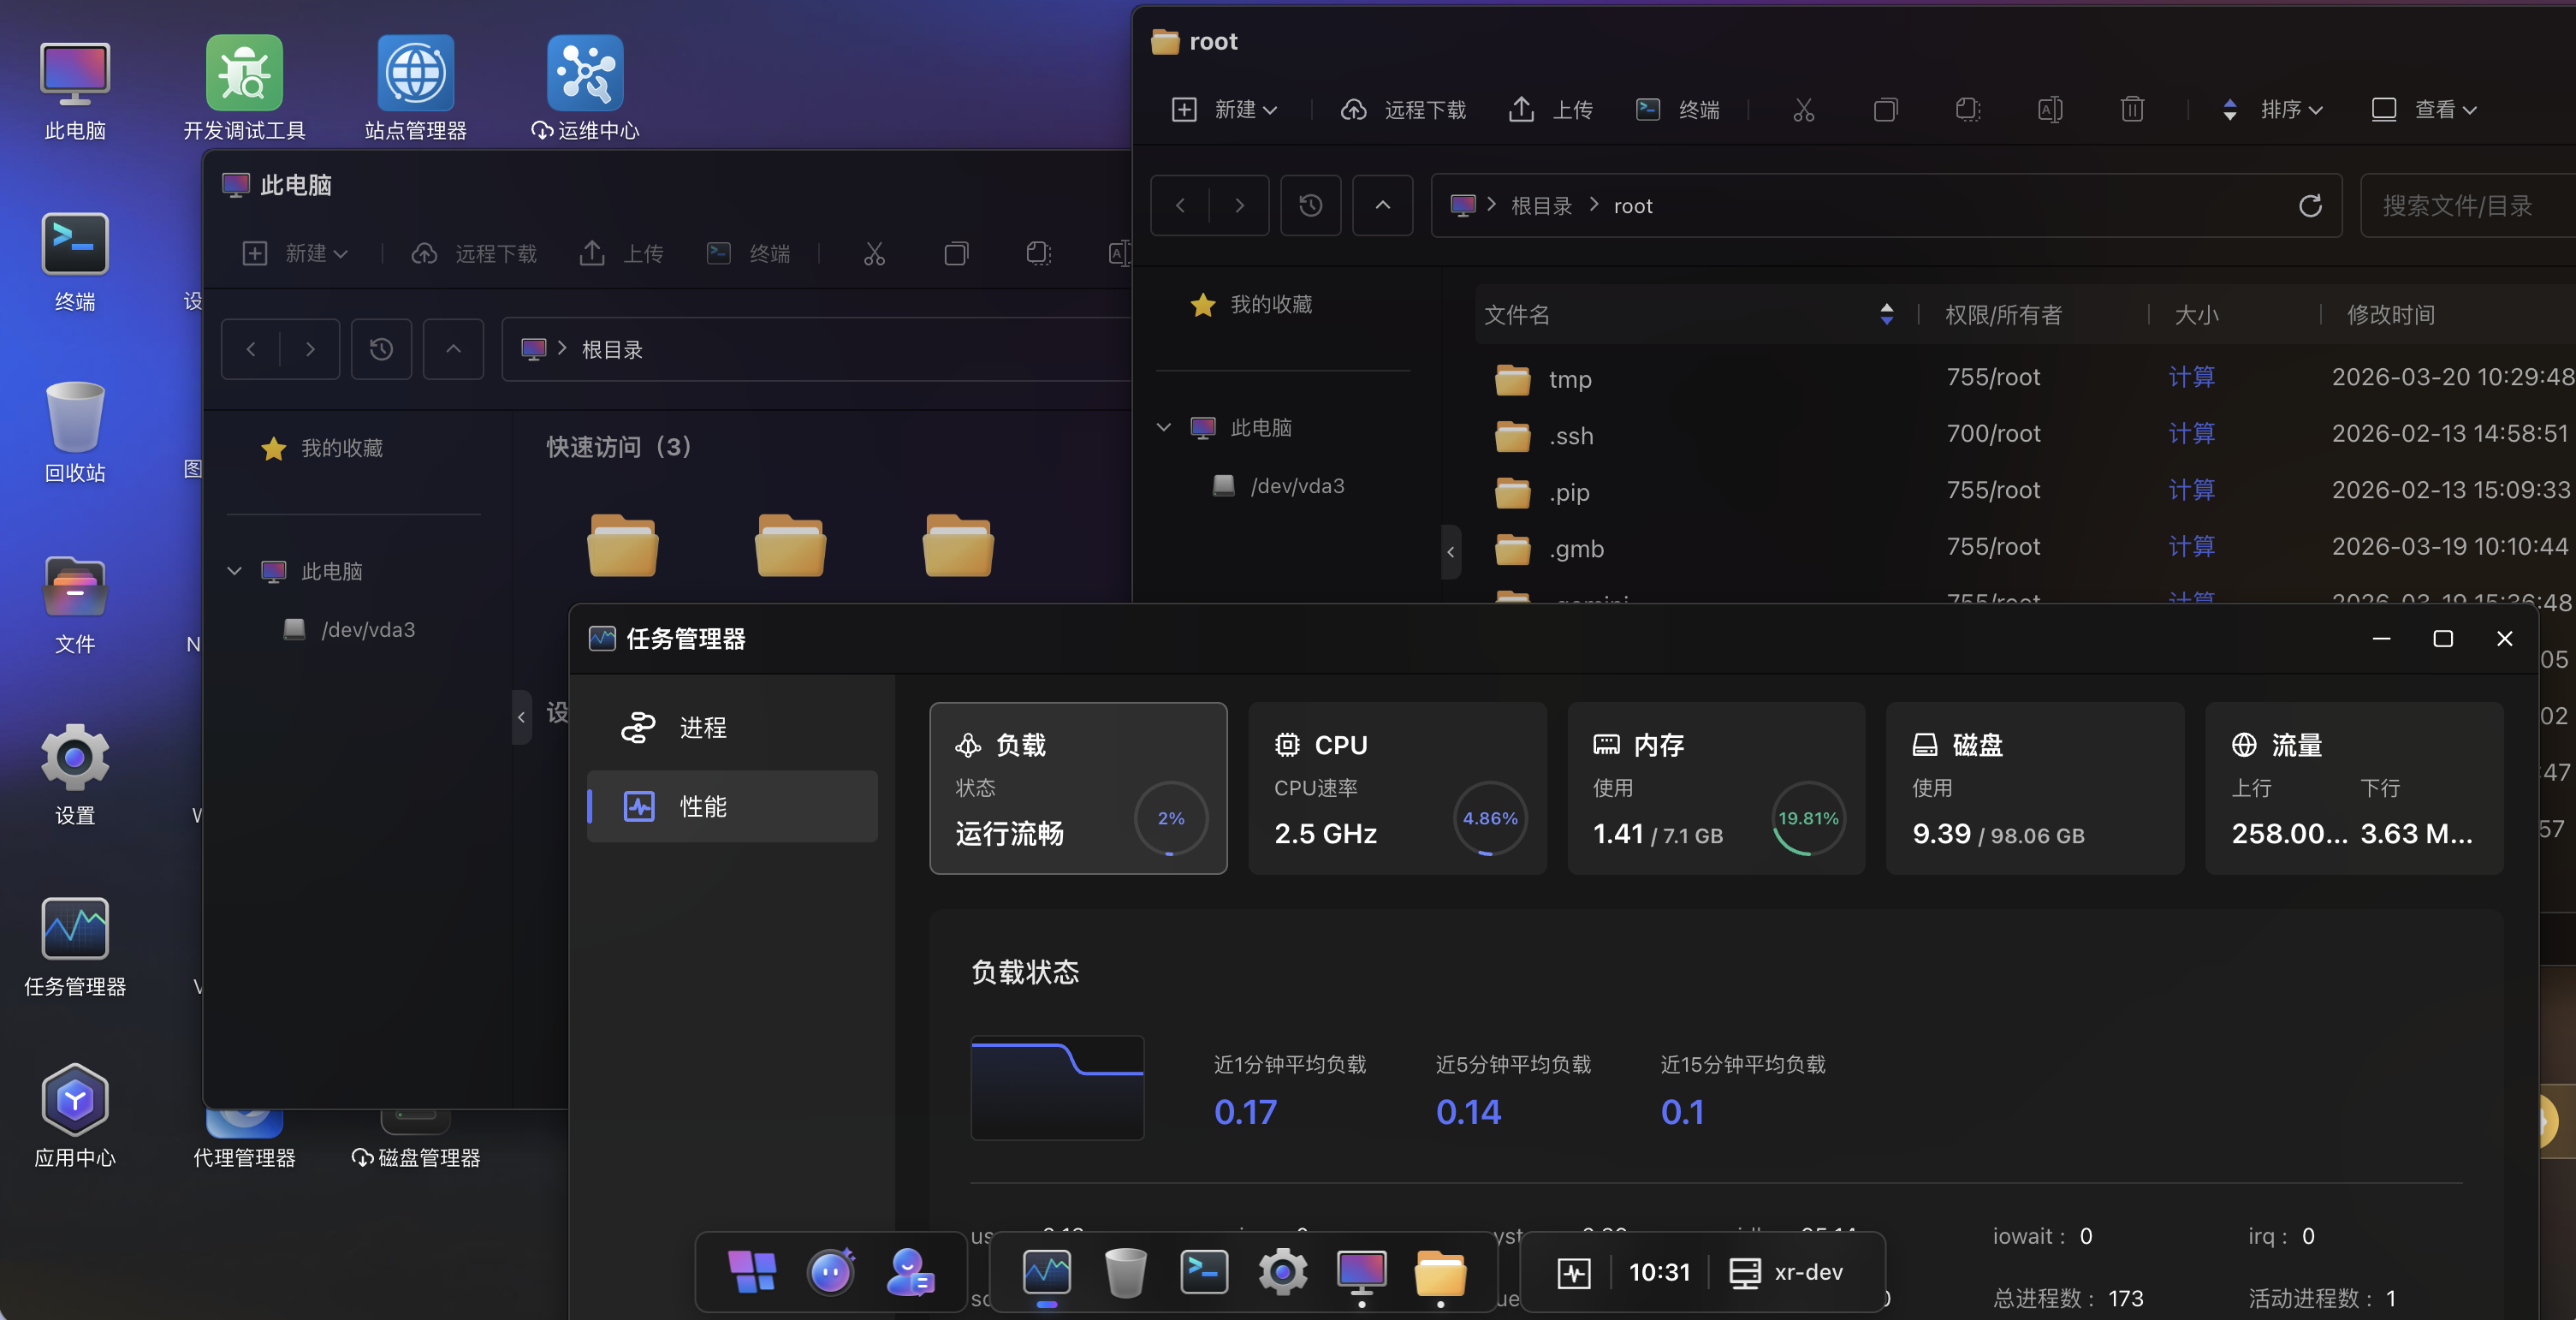
The desktop arranges all available management applications in an icon grid, with the bottom taskbar showing the current time and machine IP address.
Tip
For more about GMSSH Desktop, see: GMSSH Desktop
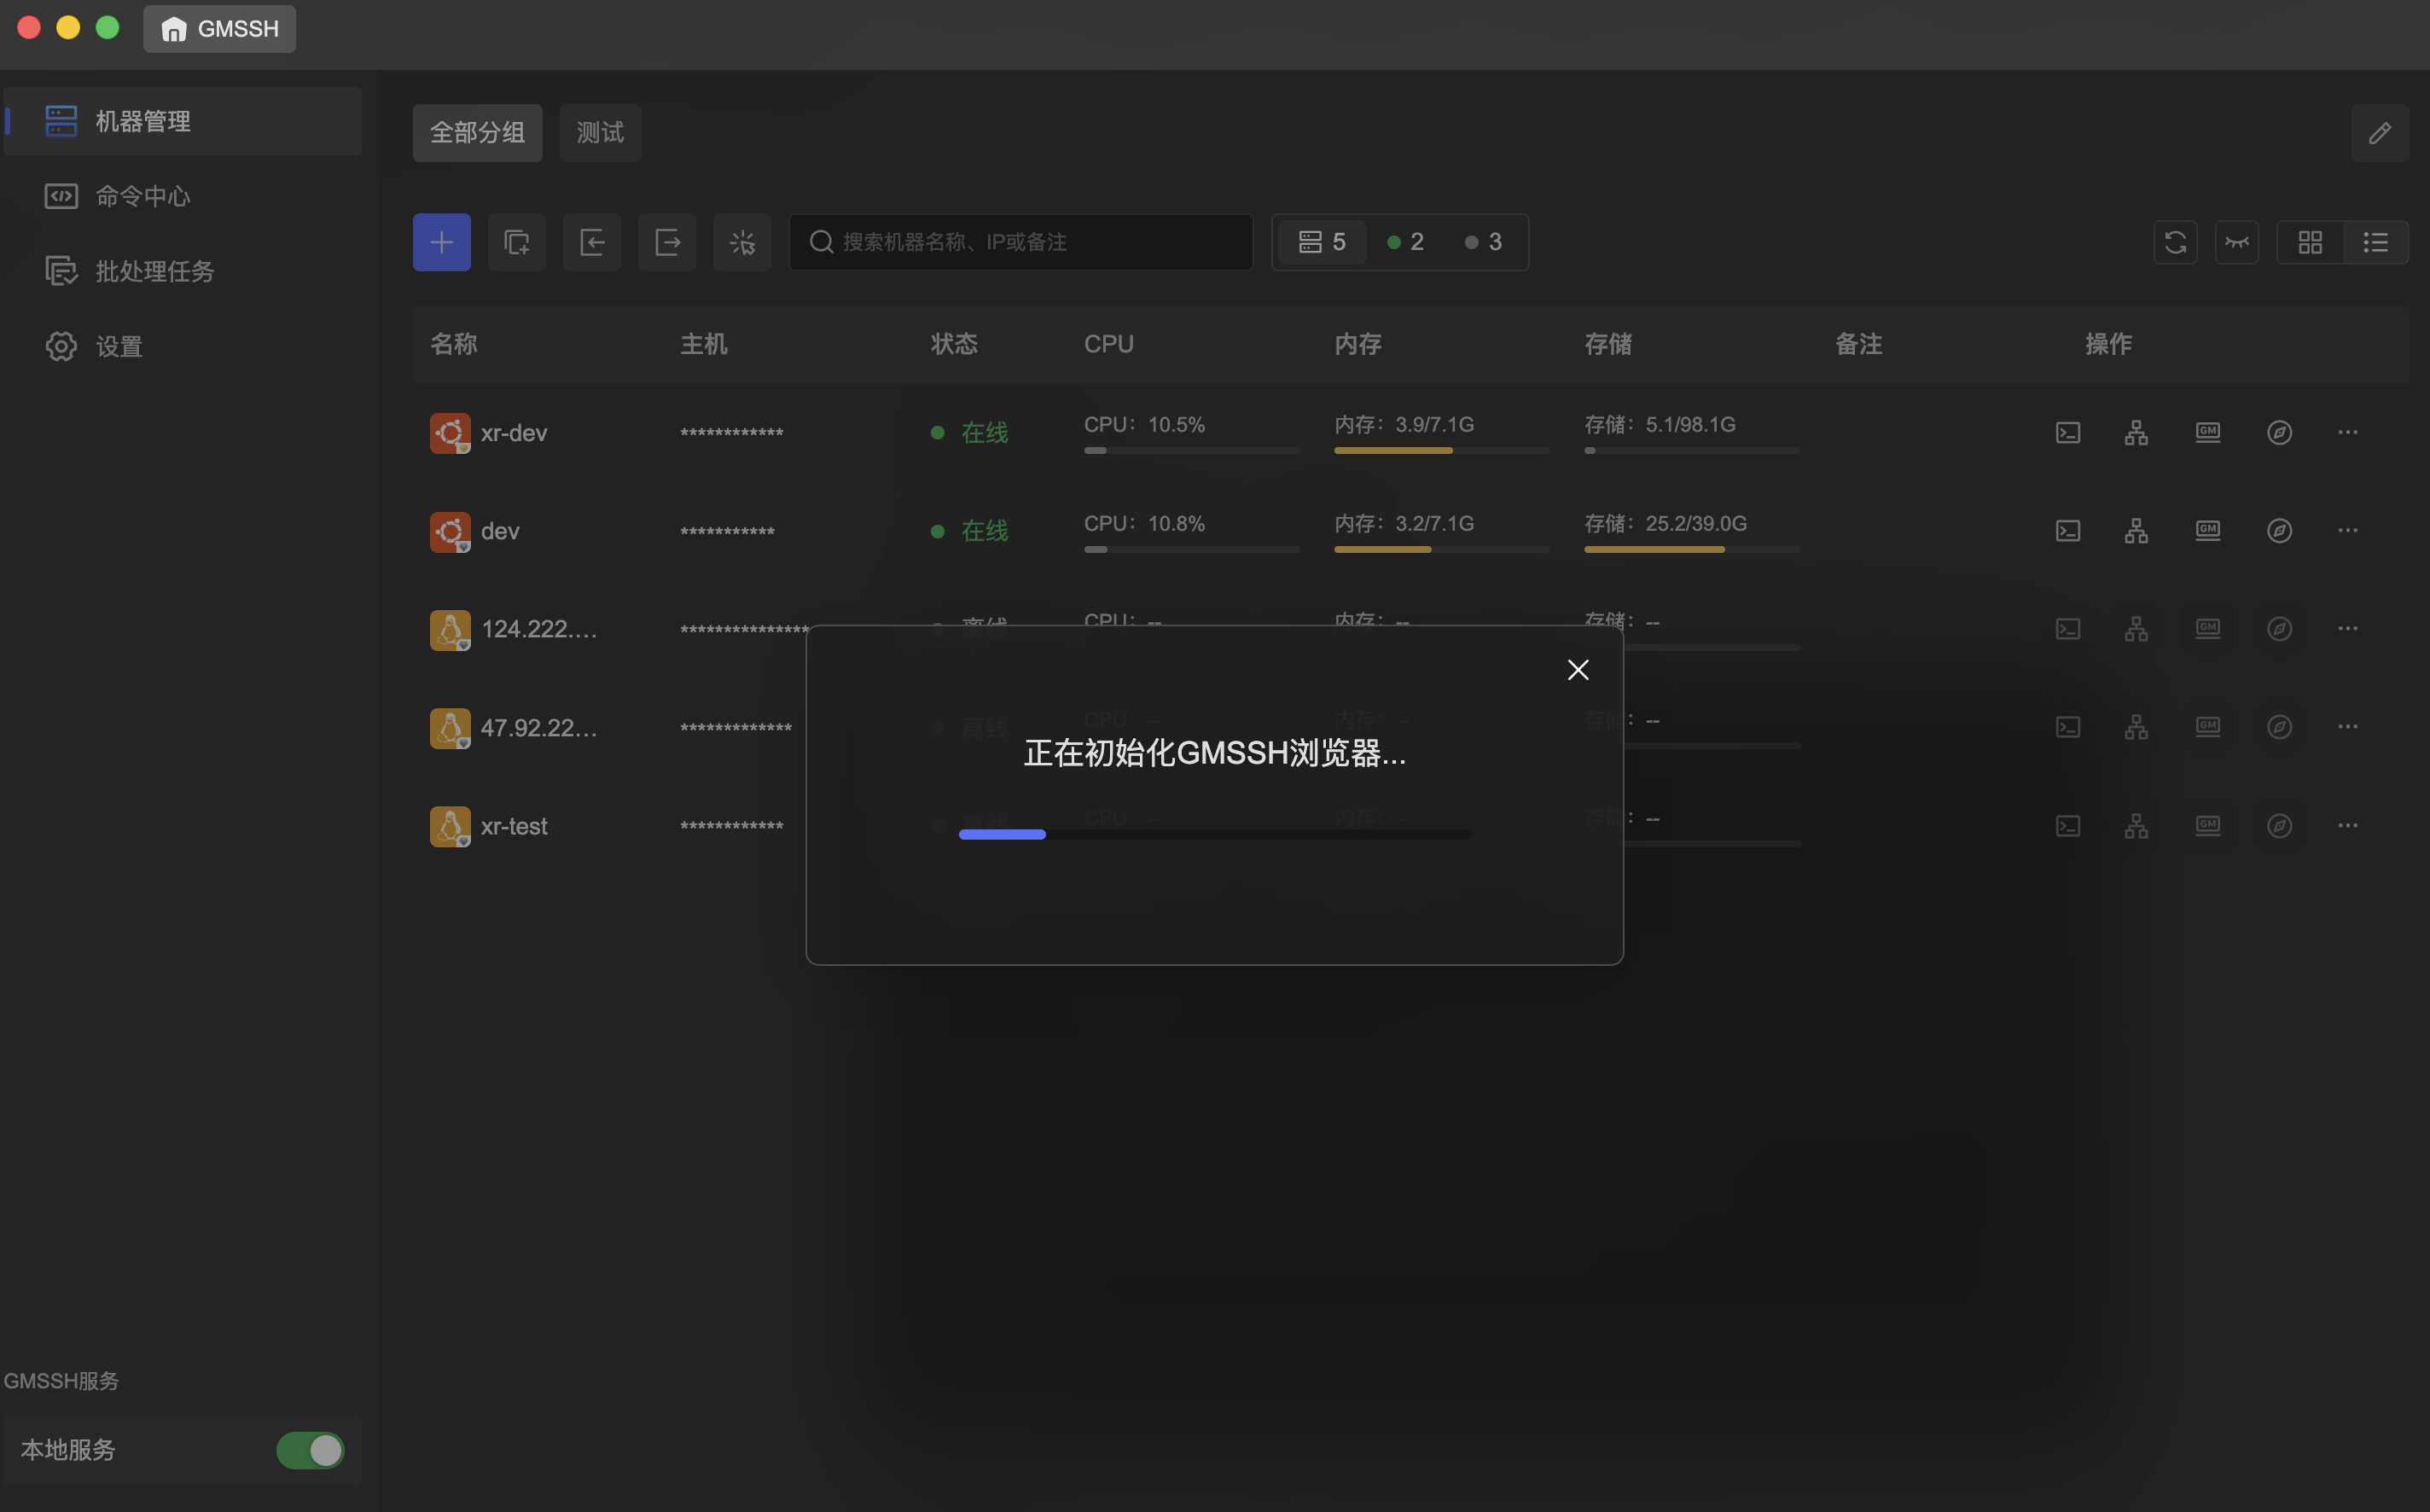
GMSSH Browser
Click the "GMSSH Browser" button to launch the GMSSH Browser. On first launch, an "Initializing GMSSH Browser..." progress prompt appears, then automatically enters the browser interface.
One-click access to remote web pages, hassle-free. No remote desktop needed, no extra configuration — just one click in GMSSH to open server web pages directly in a local window. Preview results, adjust pages, or demo — everything feels as smooth as working on a local project.
- No Remote Desktop Needed: Renders server web content locally via SSH secure connection, no VNC or RDP required.
- Zero Extra Installation: No browser or graphical environment required on the server side — lightweight and hassle-free.
- Multi-Machine Parallel: Manage multiple servers simultaneously, each session runs independently.
- Secure & Efficient: All data transmitted through SSH encrypted channel for privacy and stability.
- Smooth as Local: Web pages loaded by the server, screens synced to local in real-time — responsive and silky smooth.
Tunnel Settings
GMSSH supports configuring SSH tunnels (port forwarding) for each machine, enabling secure network traffic relay.
The tunnel settings panel supports three forwarding types:
| Forwarding Type | Description | Typical Use Case |
|---|---|---|
| Local Forwarding | Forward local port traffic to a remote server's target port | Access databases, web services on remote intranet |
| Remote Forwarding | Forward remote server port traffic to a local target port | Expose local dev environment to the remote server |
| Dynamic Forwarding | Create a local SOCKS proxy for dynamic traffic forwarding | Proxy access to restricted network resources |
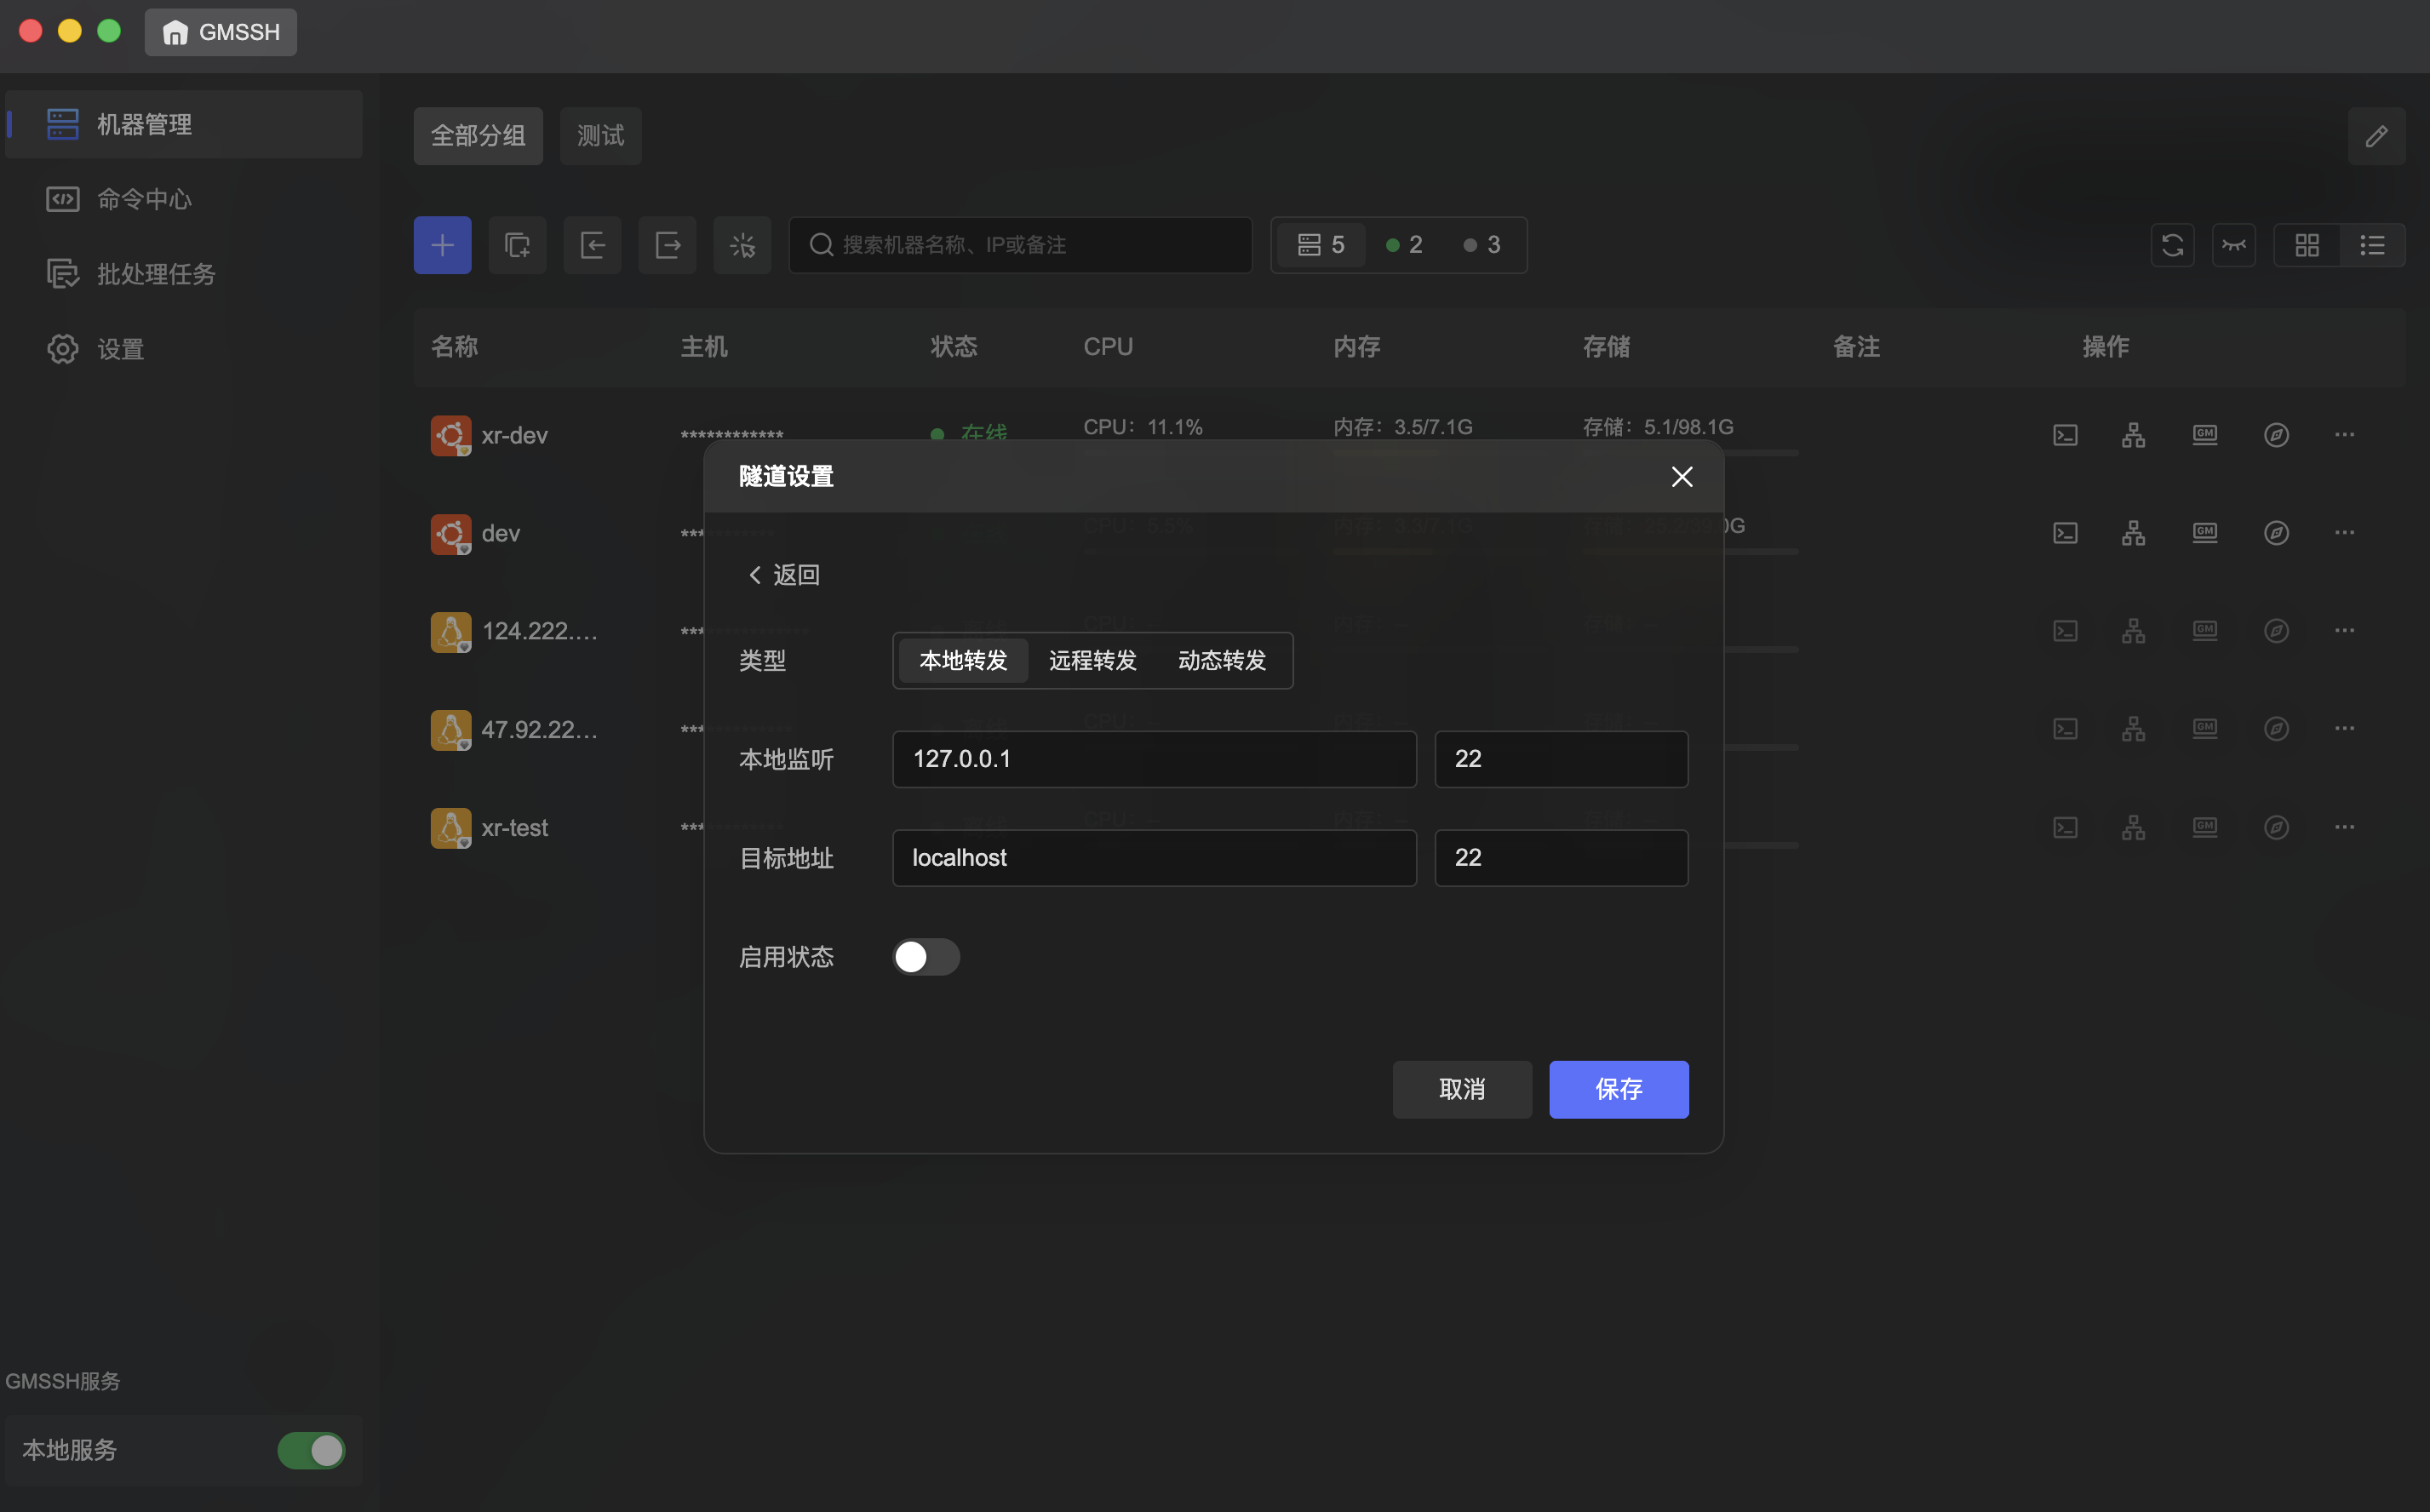
Configuration Fields
| Field | Description |
|---|---|
| Type | Select forwarding type: Local / Remote / Dynamic |
| Local Listen | Local listening IP and port (e.g., 127.0.0.1:22) |
| Target Address | Forwarding target address and port (e.g., localhost:22) |
| Enable | Toggle to enable/disable the tunnel rule |
- Click "< Back" to return to the tunnel list.
- Click "Save" to apply, or "Cancel" to discard.
GMSSH Service
The client bottom provides a GMSSH Service status bar showing local service status:
- Local Service: Toggle to start/stop the local GMSSH service. When enabled, the client can monitor resource status (CPU, Memory, Storage) for all connected machines in real-time.